

In the life insurance industry, the growth of predictive models and data-driven risk assessment is undeniable. This transformation is expanding rapidly and gaining traction, but with all transformation, there will be bumps along the way. One such bump is the often-opaque nature of predictive models, especially when it comes to how they work and how to talk about their results to advisors, brokers, reinsurers and applicants.
At LifeScore Labs, we believe there are two primary ways to improve the ‘explainability’ of predictive models and their value: one is conceptual; one is tangible.
Conceptual explainability: The power of data science
One reason a predictive model is so valuable in enhancing the traditional life underwriting process is its machine-learning ability. A predictive model’s algorithm can simultaneously account for and identify patterns from many, many more health-related variables than a human can.
While traditional analytical methods can generally factor in two or perhaps three data points at a time (e.g., BMI or blood pressure), a predictive risk model uses machine learning to identify patterns and complex interactions among literally dozens of different lab and health variables.
LifeScore Med360SM for example, aggregates dozens of health data points in multiple functional areas. Then it recognizes patterns within these variables and assigns a mortality risk score accordingly.
LifeScore Med360 includes the same widely used and understood inputs that underwriters have relied on for decades. The difference is that while the human brain can balance and see patterns within only a handful of these variables, a machine learning algorithm can do the same for dozens of variables and account for millions of permutations of these variables in just a few seconds. Historical results, validation and testing have proven that risk assessments performed by LifeScore Med360 is much more accurate than traditional rules-based underwriting.
The human brain can balance and see patterns within only a handful of these variables, a machine learning algorithm can do the same for dozens of variables and account for millions of permutations of these variables in just a few seconds.
Of course, a predictive model doesn’t replace an existing underwriting process — it complements and enhances it. In fact, underwriters may have more information than the model can ingest. In such instances, human oversight ensures that the model is used appropriately.

Tangible explainability: The Score Report
The second way that life underwriters can better understand and embrace a predictive risk model is by shining a light into how the model works. The best models, in fact, are designed to be transparent, clearly displaying their data inputs and outputs so underwriters can see the value for themselves.
This is exactly why we provide an at-a-glance, easy-to-interpret dashboard that illustrates the results for all our predictive models. This tangible tool combines dozens of contributing factors — both positive (e.g., low BMI) and negative (e.g., high blood pressure) — and calculates an applicant’s overall risk (or life) score, from zero to 100. This score, and its determining positive and negative factors, are clearly and graphically displayed in the Score Report.
The Score Report is an easy-to-interpret dashboard that illustrates the results for all our predictive models.
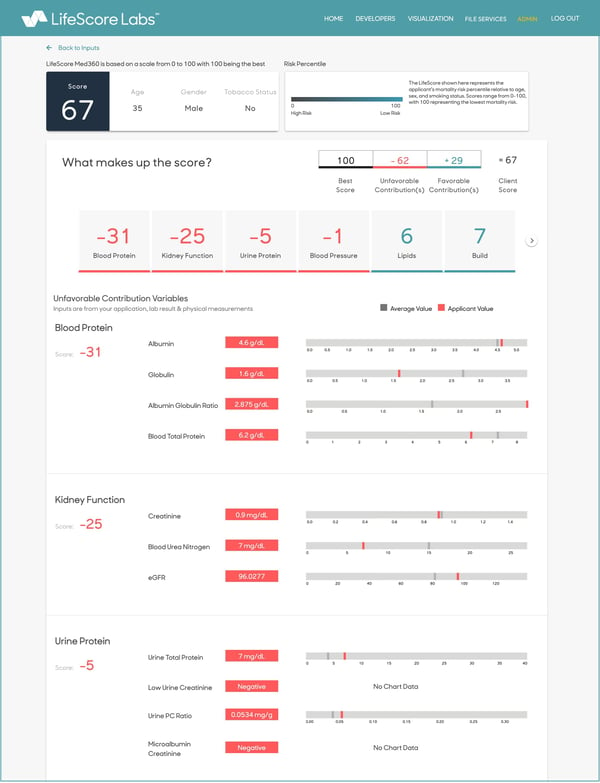
By providing transparency into all the factors of a risk assessment, LifeScore Labs’ Score Report helps underwriters understand exactly what drives the model results and the overall risk assessment. It includes all the data inputs and is used as a tool to help communicate the analysis to the agent, broker or client.
Armed with both a conceptual understanding of predictive risk models and a tangible dashboard that graphically displays risk scores and its contributing data points, underwriters can better understand — and explain to advisors, brokers and applicants — what is driving the risk assessment.
For more information on predictive models and how LifeScore Labs’ solutions enhance accelerated underwriting, traditional underwriting and data-driven underwriting with electronic health records, email contact@lifescorelabs.com and check out the LifeScore Med360 demo.
MM202504-302020