
In a perfect world, when we work toward the same goal, we get there faster. But are we working toward the same goal? What is our life insurance Shangri-La?
The United States is facing an estimated life insurance coverage gap of US $12 trillion industrywide,1 and the average shortfall between what people have and what they need is approximately US $200,000.2 This gap puts millions of families at risk.
How do we make life insurance more accessible and close the gap for millions (our life insurance Shangri-La)? We believe that a portion of the road to Shangri-La is an individualized customer experience.
Before we begin, let's make the clear distinction between “individualized” and “personalized.”
An individualized customer experience is a scalable, tailored underwriting process, application, score, and risk that is unique for each individual person. Applicants are not grouped and priced as part of a cohort or class.
A personalized experience is when the applicant’s name appears in correspondence or during the application process. Today, the process is personalized: “Bob, do you smoke?” However, pricing is still determined by placing the applicant in a class or cohort based on a rules engine and then priced accordingly.
As the industry becomes more comfortable with data-driven decisions, the individualized process is coming into view.
While there’s still a long way to go, we’re excited about the progress we’ve made. It’s worthwhile to take a look at some of the milestones we’ve reached thus far.
MILESTONE #1
Invest in your data. “Nothing is more valuable than your historical data. You need to invest in transforming your data to be usable.”
Traditional carriers are making significant investments in their data. They’re hiring data scientists and analysts and purchasing data from third-party vendors. The recent LIMRA panel discussion What’s on the Minds of Life Insurance Executives Globally3 could not have made this more clear. Its global survey of life insurance executives identified top concerns in the industry.
Technology tops the list for 2021.
MassMutual recognized this years ago and digitized applications with lab tests from 1999 to 2019. The data set included more than 1.5 million records, 13 million exposure years, and 23,000 observed deaths (including applicants who did not become policyholders).
They also partnered with a vendor specializing in handwriting recognition to digitize paper and archived applications. While this was a large, manual effort to standardize questions across time, states, and products, it was essential in mapping historical data to the current application.
Not only does the resulting data set include attributes such as lab tests, it also includes personal and family health histories, policy and underwriting information, and the mortality outcome.
MILESTONE #2
A data governance team that breaks down the silos between underwriters, actuaries, data scientists, legal advisers, and ethical consultants.
Easier said than done. This requires changing the structure of the entire organization to ensure that the front end, underwriting, pricing, and the back end are all working together to create an individualized customer experience. Teams share goals and elements of model management.
Our team is made up of individuals from diverse disciplines: business, legal, data science, underwriting, actuarial, medical, and data equity. This cross-functionality allows the data science team to create the models and creates cohesion between pricing, underwriting, customer experience, and oversight.
The governance team meets regularly to ensure we proactively re-examine the data and how we use it.
Because monitoring and oversight are inextricably linked to the model road map, this team also evaluates data sources, sets, and inputs to:
- Identify potential statistical and collection biases.
- Reexamine and revalidate the data sources to ensure they achieve the modeling objective.
- Monitor the data’s stability over time.
In the spirit of continuous improvement, this milestone is revisited every year.
MILESTONE #3
On the horizon: a fast, transparent, and individualized process.
Applicants don’t want to think about life insurance. Those who do, don’t want to go through a highly invasive, time-consuming process to get a price they don’t understand. That’s why we expanded the data set to include other data sources that can make it easier and faster for the applicant:
- Credit and public records
- Electronic health records
- And more to come...
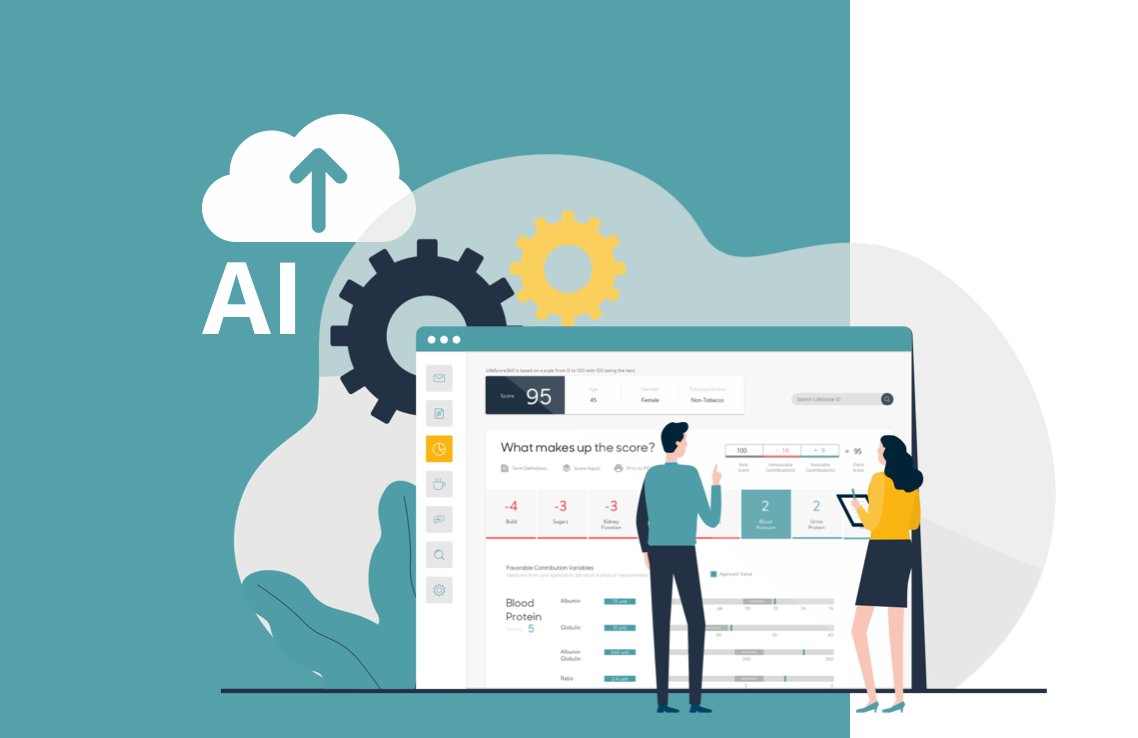
And because our models are transparent, underwriters, actuaries, advisers, and even applicants can understand exactly what factors make up their score.
Clients who leverage the models return a score and explain the factors that make up that score, all within seconds.
Data scientists continuously look at new sources of data to create an even more instantaneous and individualized experience.
When looking back at the investment of time it took to transform our own organization, it’s understandable why some of our clients feel it’s too large of an undertaking. But the good news is that we’ve reached these milestones on the road to Shangri-La so that you don’t have to.
1James T. Scanlon, “Life Insurance Ownership in Focus,” LIMRA Ownership Study, September 28, 2016.
2LIMRA, “Facts about life 2020,” September 2020.
3LIMRA and Boston Consulting Group, “What’s on the Minds of Global Life Insurance Executives: Responding to the Moment, Looking to the Future.” October 2021.
CRN202311-284780